
Quick answer
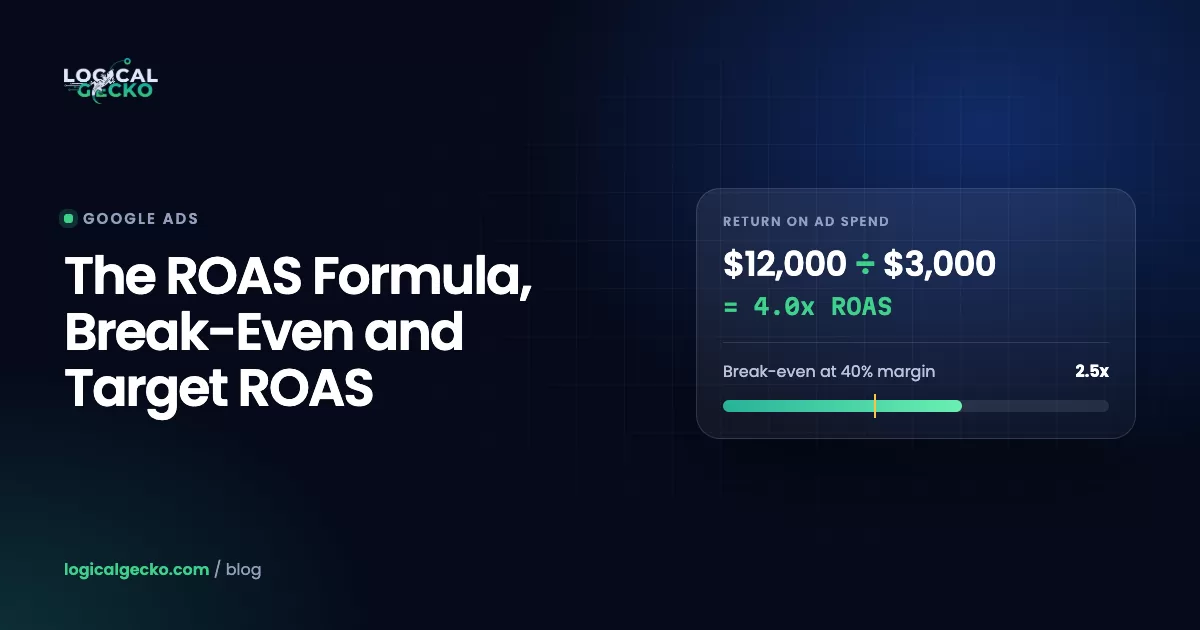
The ROAS formula is revenue from ads ÷ ad spend. Spend $1,000 and earn $4,000 in attributed revenue, and your ROAS is 4, written as 4:1, 4x or 400%. To know whether that is profitable, compare it with your break-even ROAS, which is 1 ÷ your profit margin. A 40% margin needs at least 2.5x.
Key takeaways
- ROAS = revenue from ads ÷ ad spend; 4:1, 4x and 400% all describe the same result.
- Break-even ROAS = 1 ÷ contribution margin, where the margin is net of COGS, shipping, payment fees and returns, not just product cost.
- To build in profit, use target ROAS = 1 ÷ (margin − desired profit %); a 40% margin with a 10% profit goal needs 3.33x.
- A good ROAS is any ROAS comfortably above your own break-even, so a 2.5x can be healthy for one store and a loss for another.
- Google Ads reports ROAS as Conv. value / cost, and it can overstate true return because of attribution, returns and repeat orders.
On this page
- What is ROAS?
- What is the ROAS formula?
- How do you calculate ROAS? (with worked examples)
- What is break-even ROAS and how do you calculate it?
- How do you set a target ROAS that makes a profit?
- What is a good ROAS?
- ROAS vs ROI vs MER vs ACoS: what is the difference?
- How does Google Ads calculate and report ROAS?
- Why can your reported ROAS be misleading?
- How do you calculate ROAS in Excel or Google Sheets?
- How can you improve ROAS without stalling growth?
- FAQ
What is ROAS?
ROAS stands for return on ad spend. It measures how much revenue your ads bring in for every dollar you spend on them. A ROAS of 5 means each $1 of ad spend produced $5 in sales that the ad platform attributed to your ads.
ROAS is a revenue metric, not a profit metric. It tells you how efficiently ad dollars turn into sales, but it ignores what those sales cost you to fulfill. That gap is why two stores can both report "4x ROAS" while one is growing profitably and the other is quietly losing money on every order. The rest of this guide closes that gap.
What is the ROAS formula?
The ROAS formula is revenue from ads divided by ad spend. Both numbers must cover the same campaigns and the same date range.
Revenue from ads ÷ Ad spendThe result is a plain number, but you will see it written three ways. They all mean the same thing:
| Notation | How it is written | Formula | Where you see it |
|---|---|---|---|
| Multiplier | 4x | Revenue ÷ Spend | Agency reports, Meta, most dashboards |
| Ratio | 4:1 | Revenue ÷ Spend, shown against 1 | Finance teams, older guides |
| Percentage | 400% | (Revenue ÷ Spend) × 100 | Google Ads Target ROAS setting |
The percentage format trips people up. A 400% ROAS is not a 400% profit; it is simply 4x written differently. A ROAS of 100% (1x) means you got back exactly what you spent in revenue, which is a loss once product costs are counted.
How do you calculate ROAS? (with worked examples)
To calculate ROAS, add up the revenue attributed to a campaign, add up what you spent on it over the same period, and divide the first by the second. Use the calculator below to run your own numbers, including your break-even point.
- Pick the scope and date range. One campaign, one channel or the whole account, for example the last 30 days. Mixing a month of revenue with two weeks of spend is the most common error.
- Get attributed revenue. In Google Ads this is the Conv. value column for your purchase conversion action. Use revenue after discounts.
- Get ad spend. The Cost column for the same scope and dates. Keep agency fees and software out of ROAS; they belong in ROI.
- Divide revenue by spend. Multiply by 100 if you need the percentage version.
Example 1: a single Shopping campaign
A Shopping campaign spends $2,500 in a month and records $11,250 in conversion value. ROAS = $11,250 ÷ $2,500 = 4.5x (4.5:1, or 450%).
Example 2: comparing two campaigns
Performance Max spends $6,000 and returns $21,000 (3.5x). A brand Search campaign spends $800 and returns $9,600 (12x). The brand campaign looks four times better, but most of those people were already searching for your store by name. The section on misleading ROAS below explains why that number flatters you.
Example 3: working backward from a goal
If you need $50,000 in ad-driven revenue next month and your campaigns reliably deliver 5x, you will need roughly $10,000 in spend ($50,000 ÷ 5). ROAS is as useful for budgeting as it is for reporting.
What is break-even ROAS and how do you calculate it?
Break-even ROAS is the lowest ROAS at which your ads pay for themselves: every order covers its product and fulfillment costs plus the ad spend that won it, with nothing left over. The formula is 1 ÷ your contribution margin. Below it you lose money on every ad-driven sale; above it you make money.
1 ÷ Contribution margin (as a decimal)Where the formula comes from
Say an order brings in revenue R, and your margin m is the share of that revenue left after all variable costs. The money available to pay for ads is R × m. You break even when ad spend equals exactly that amount:
- Ad spend = R × m
- Divide both sides by ad spend and by m: R ÷ Ad spend = 1 ÷ m
- R ÷ Ad spend is ROAS, so break-even ROAS = 1 ÷ m
Which costs belong in the margin
This is where most break-even numbers go wrong. Using gross margin (price minus product cost) alone makes your break-even look lower than it really is. Include every cost that scales with each order:
- Cost of goods sold (landed cost, including freight in and duties)
- Outbound shipping and fulfillment or 3PL pick-and-pack fees
- Packaging and inserts
- Payment processing fees (for example, a percentage plus a fixed fee per transaction)
- Average returns, refunds and chargebacks as a percentage of revenue
- Per-order app or marketplace fees, if any
Leave out fixed costs such as salaries, rent and software subscriptions. They matter for overall profit, but they do not change with each extra order your ads produce.
Worked break-even example
An average order of $80 carries $32 in COGS, $9 in shipping, $2.62 in payment fees (2.9% + $0.30), $1.50 in packaging and a $2.40 returns allowance (3%). Variable costs total $47.52, which leaves a contribution of $32.48, or a 40.6% margin. Break-even ROAS = 1 ÷ 0.406 = 2.46x.
Had you used gross margin alone ($48 ÷ $80 = 60%), you would have calculated a break-even of 1.67x and treated a 2.0x campaign as profitable. It is not: at 2.0x this store spends $40 in ads to win each $80 order and loses about $7.52 on it.
How do you set a target ROAS that makes a profit?
Break-even is a floor, not a goal. To leave a set profit on every ad-driven sale, subtract your desired profit percentage from your margin before dividing:
1 ÷ (Contribution margin − Desired profit %)Using the store above: a 40.6% margin with a goal of keeping 15% of revenue as profit after ads gives 1 ÷ (0.406 − 0.15) = 1 ÷ 0.256 = 3.91x. If you enter that in Google Ads, it becomes a Target ROAS of 391%.
Two practical adjustments:
- Account for lifetime value. If first orders reliably lead to reorders, you can accept a target closer to break-even on acquisition campaigns, because the profit arrives on the second and third order. Only do this with real repeat-purchase data from your store, not a hopeful guess.
- Set different targets by margin tier. A single account-wide target forces high-margin products to subsidize low-margin ones. Group products by margin in your Shopping or Performance Max structure and give each group its own target.
What is a good ROAS?
A good ROAS is one that sits comfortably above your own break-even ROAS, which depends on your margin. You will often see "4:1" quoted as the benchmark, but that number only means something if your contribution margin is around 25%. A store with a 60% margin can grow profitably at 2x; a store with a 20% margin loses money at 4x.
| Contribution margin | Break-even ROAS | ROAS for 10% profit | ROAS for 20% profit |
|---|---|---|---|
| 15% | 6.67x (667%) | 20.0x | Not reachable |
| 20% | 5.00x (500%) | 10.0x | Not reachable |
| 25% | 4.00x (400%) | 6.67x | 20.0x |
| 30% | 3.33x (333%) | 5.00x | 10.0x |
| 40% | 2.50x (250%) | 3.33x | 5.00x |
| 50% | 2.00x (200%) | 2.50x | 3.33x |
| 60% | 1.67x (167%) | 2.00x | 2.50x |
| 70% | 1.43x (143%) | 1.67x | 2.00x |
Read the table as "given my margin, what do I have to hit?" That also answers the common questions directly. Is 2.5x good? Yes at a 50% margin, break-even at 40%, a loss at 30%. Is 3.8x good? It clears break-even for any margin above about 26%.
What drives high ROAS in practice is usually structure rather than luck. Fire Pit Surplus reached 8.6x ROAS on $25.6K of spend, producing $220K in sales, by holding a strict ROAS floor per campaign and only scaling spend on products with proven profitability. Oil-Stores held 21.5x ROAS (€292,901 in tracked conversion value on €13,608 of spend) while monthly spend scaled more than 12x, because the catalog was segmented by category so budget flowed to lines that converted. Both started from the same rule: know the floor, then scale only what clears it.
ROAS vs ROI vs MER vs ACoS: what is the difference?
ROAS measures ad revenue per ad dollar. ROI measures profit per dollar invested. MER measures total store revenue per dollar of total marketing. ACoS is simply ROAS flipped upside down. Each answers a different question, so serious stores track more than one.
| Metric | Formula | Answers | Example ($10K spend, $40K ad revenue, 40% margin) |
|---|---|---|---|
| ROAS | Ad revenue ÷ Ad spend | How efficiently do ads turn spend into sales? | 4.0x |
| ACoS | Ad spend ÷ Ad revenue | What share of ad revenue went to ads? | 25% |
| ROI (on ad spend) | (Contribution profit − Ad spend) ÷ Ad spend | Did the ads make money after all variable costs? | ($16K − $10K) ÷ $10K = 60% |
| MER (blended ROAS) | Total store revenue ÷ Total marketing spend | Is marketing as a whole paying off? | Depends on all channels and organic sales |
Converting between ROAS and ACoS: ACoS = 1 ÷ ROAS, and ROAS = 1 ÷ ACoS. A 25% ACoS is a 4x ROAS; a 20% ACoS is 5x; a 40% ACoS is 2.5x. ACoS is the standard metric in Amazon Ads, so this conversion matters if you sell on both Amazon and your own site.
MER vs ROAS: ROAS relies on each ad platform's attribution, and platforms often claim credit for the same sale. MER uses your store's actual revenue and your total marketing spend, so nothing is double counted. Use platform ROAS to steer campaigns day to day, and MER from your store data to check that the whole program is working.
How does Google Ads calculate and report ROAS?
Google Ads reports ROAS in the Conv. value / cost column, which Google defines as total conversion value divided by the total cost of all ad interactions (see Understand your conversion tracking data). It shows as a decimal, so 4.25 means 4.25x.
To add it, open Campaigns, click the Columns icon, choose Modify columns, then select Conv. value / cost under Conversions. The number is only as accurate as your conversion value, which comes from your purchase tag. If the tag sends the wrong value, counts a purchase twice, or includes tax and shipping, every ROAS figure in the account is off. That is why a clean conversion tracking setup has to come before any bid strategy. The guide to Google Ads conversion tracking walks through how to verify it before you trust a ROAS number.
The Target ROAS bid strategy
Target ROAS (tROAS) is a Smart Bidding strategy that sets bids to maximize conversion value while trying to keep your average Conv. value / cost at the target you choose. In most campaign types you now set it inside the Maximize conversion value strategy as an optional target. Things to know from Google's Target ROAS documentation:
- It is entered as a percentage. Google's own example: $5 in sales for every $1 of spend is a 500% target ROAS. Typing 5 instead of 500 tells Google you are happy with 0.05x.
- It needs conversion history. Google lists at least 15 conversions in the past 30 days for Search and Shopping, and conversions must carry a value above zero.
- A higher target means less volume. Setting the target too high limits the auctions you enter. Google suggests lowering the target gradually to grow volume, and allowing one to two conversion cycles after each change.
- Targets now bind more tightly. Since August 17, 2026, budget-limited campaigns on target-based strategies deliver closer to the target you set instead of overshooting it. If a campaign was beating its tROAS, its ROAS now trends toward the stated target unless you raise it (Google's announcement).
Pro tip: Start your tROAS near the ROAS the campaign achieved over the last 30 to 60 days, not at your ideal number. Then step it toward your profit target in small increments, checking volume after each move.
Why can your reported ROAS be misleading?
Reported ROAS is an attribution estimate, not a bank statement. It usually runs higher than the return your ads really caused, for five common reasons.
- Attribution overlap. Google uses data-driven attribution by default for most conversion actions (About attribution models). Meta, email and affiliates use their own rules. Add up every platform's claimed revenue and it often exceeds what your store actually sold.
- Returns and refunds. Google Ads counts the sale when it happens. A refunded order stays in your ROAS unless you upload conversion adjustments to retract or restate it. For apparel and other high-return categories, that gap can be large.
- Repeat orders and brand search. Branded Search and remarketing often show very high ROAS because they reach people who were going to buy anyway. Google's acquisition goal lets value-based bidding value first-time orders higher than repeat ones, which pushes spend toward growth rather than repeat orders.
- Conversion lag. Google Ads credits a conversion to the date of the ad click, not the purchase date. Recent days look weaker than they will once late conversions arrive, so avoid judging the last week in isolation.
- Tracking errors. Duplicate tags, secondary actions set as primary, or values that include tax all inflate the number. On Spacey Digital's account, cleaning up conversion actions so only real, qualified actions fed bidding was the single biggest lever behind its 9.09x ROAS.
Reported ROAS (ad platform)
- Gross order value, sometimes including tax and shipping
- Credit shared or duplicated across platforms
- Refunds stay counted unless adjusted
- First and repeat orders valued equally
True ROAS (your books)
- Product revenue after discounts and returns
- Checked against store revenue with MER
- Refunds retracted or restated
- First-order revenue tracked separately
How do you calculate ROAS in Excel or Google Sheets?
Put ad spend in column B and attributed revenue in column C, then enter =IFERROR(C2/B2,0) in D2 and fill down. IFERROR stops a divide-by-zero error on rows with no spend. The same formulas work in Excel and Google Sheets.
| What you want | Formula (row 2) | Inputs |
|---|---|---|
| ROAS as a multiplier | =IFERROR(C2/B2,0) | B = spend, C = revenue |
| ROAS as a percentage | =IFERROR(C2/B2,0), formatted as % | Shows 4 as 400% |
| Break-even ROAS | =1/E2 | E = contribution margin as a decimal (0.406) |
| Target ROAS for profit | =1/(E2-F2) | F = desired profit % as a decimal (0.15) |
| ACoS | =IFERROR(B2/C2,0) | Formatted as % |
| Above break-even? | =IF(D2>=1/E2,"Profitable","Losing money") | D = ROAS |
For a cleaner display, apply the custom number format 0.00"x" to the ROAS column so 4.5 shows as 4.50x.
How can you improve ROAS without stalling growth?
Improve ROAS by raising the value of each conversion or cutting spend that does not convert, in that order of priority. Cutting budget alone raises ROAS but often lowers total profit.
- Fix measurement first. Confirm one primary purchase action, correct values and no duplicates. Bad data sends Smart Bidding in the wrong direction.
- Segment products by margin. Put high-margin and low-margin products in separate campaigns or asset groups with their own targets, so bidding reflects what each sale is worth.
- Improve the product feed. Titles that match how people search (brand, type, size, material) win more relevant Shopping traffic. Feed quality is a core part of Merchant Center management for exactly this reason.
- Cut wasted queries. Review search terms weekly and add negatives for research, DIY and irrelevant traffic.
- Raise order value. Bundles, free-shipping thresholds and cross-sells lift conversion value without extra clicks.
- Fix the landing page. A faster page with clear shipping, returns and trust signals converts more of the traffic you already pay for.
- Move targets in small steps. Raise or lower tROAS gradually and give each change one to two conversion cycles before judging it.
If you want this done on your store, our eCommerce Google Ads management is built around profit targets rather than platform ROAS alone. Or start with a free Google Ads audit: we will check your tracking, work out your real break-even ROAS and show where spend is leaking.
Frequently asked questions
Is a 2.5 ROAS good?
A 2.5 ROAS is good only if your contribution margin is above 40%, because 1 ÷ 0.40 = 2.5 is the break-even point. A store with a 50% margin makes a 10% profit on revenue at 2.5x. A store with a 30% margin needs 3.33x just to break even, so the same 2.5x loses money on every order.
What does 4:1 ROAS mean?
A 4:1 ROAS means every $1 of ad spend brought back $4 in attributed revenue. It is the same result as 4x or 400%. It does not mean you made $3 of profit per dollar; after product cost, shipping and fees, a 4:1 ROAS is profitable only when your contribution margin is above 25%.
Is 200% ROAS good?
A 200% ROAS (2x) returns $2 in revenue for every $1 spent. It breaks even at a 50% contribution margin, so it can be healthy for high-margin products like cosmetics, supplements or private-label goods, and a clear loss for resold or low-margin products. Judge it against your break-even ROAS, not an industry average.
Is it better for ROAS to be higher or lower?
Higher ROAS means more revenue per ad dollar, but higher is not always better for the business. Pushing ROAS very high usually means bidding only on the cheapest, most certain sales, which caps volume. The goal is maximum total profit: a ROAS comfortably above break-even at the largest spend that still holds it.
What ROAS is 25% ACoS?
A 25% ACoS equals a 4.0 ROAS. ACoS is ad spend ÷ revenue, so it is the inverse of ROAS: 1 ÷ 0.25 = 4. To convert the other way, divide 1 by the ROAS, so a 5x ROAS equals a 20% ACoS and a 2.5x ROAS equals a 40% ACoS.
What is true ROAS?
True ROAS is ROAS recalculated with cleaner inputs: revenue net of returns, refunds and discounts, credited only to sales the ads actually caused. It usually sits below the ROAS your ad platform reports. Many brands check it against MER (total revenue ÷ total marketing spend) from their store data to keep platform numbers honest.
Does ROAS include shipping and tax?
It depends on how your conversion value is set up. If your Google Ads purchase tag passes the full order total, reported revenue can include shipping and sales tax, which inflates ROAS. Most stores should pass product revenue after discounts and exclude tax. Check the value your tag sends against a real order before trusting the number.