
CASE STUDY · ELECTRICAL ECOMMERCE · AUSTRALIA
Resource Electrical: A$68.7K a Month From a Brand-New Account
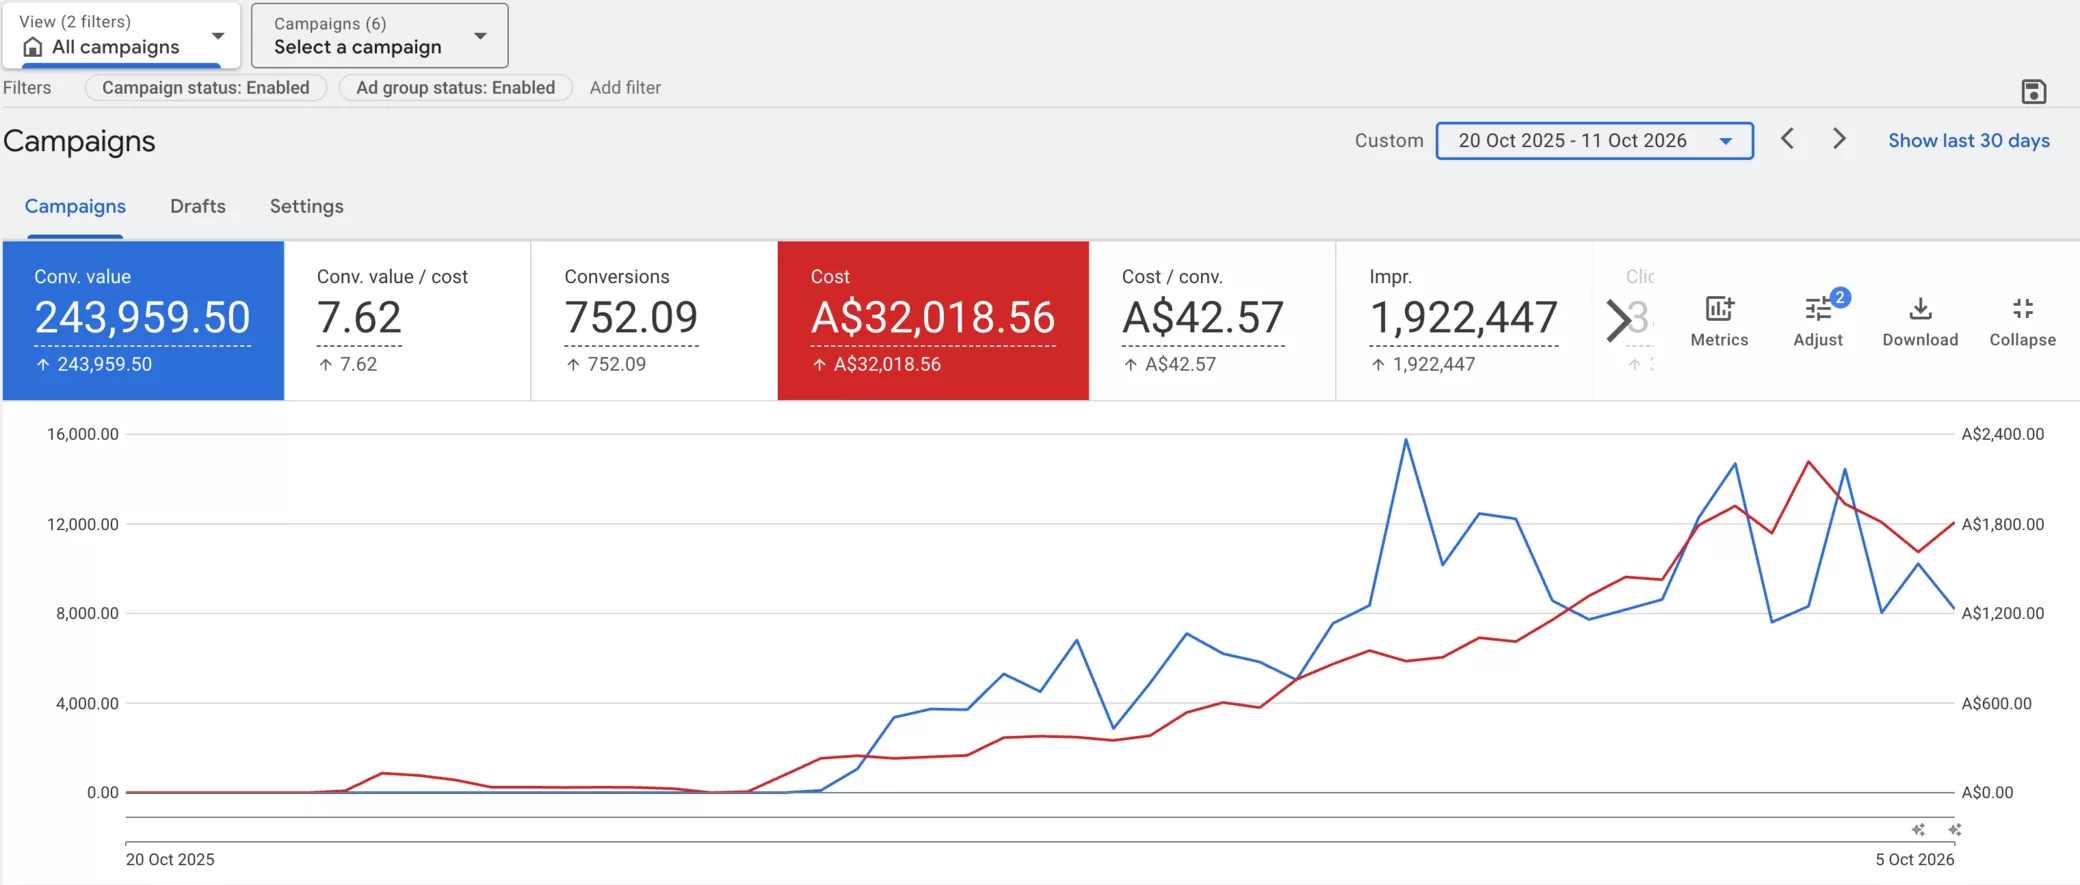
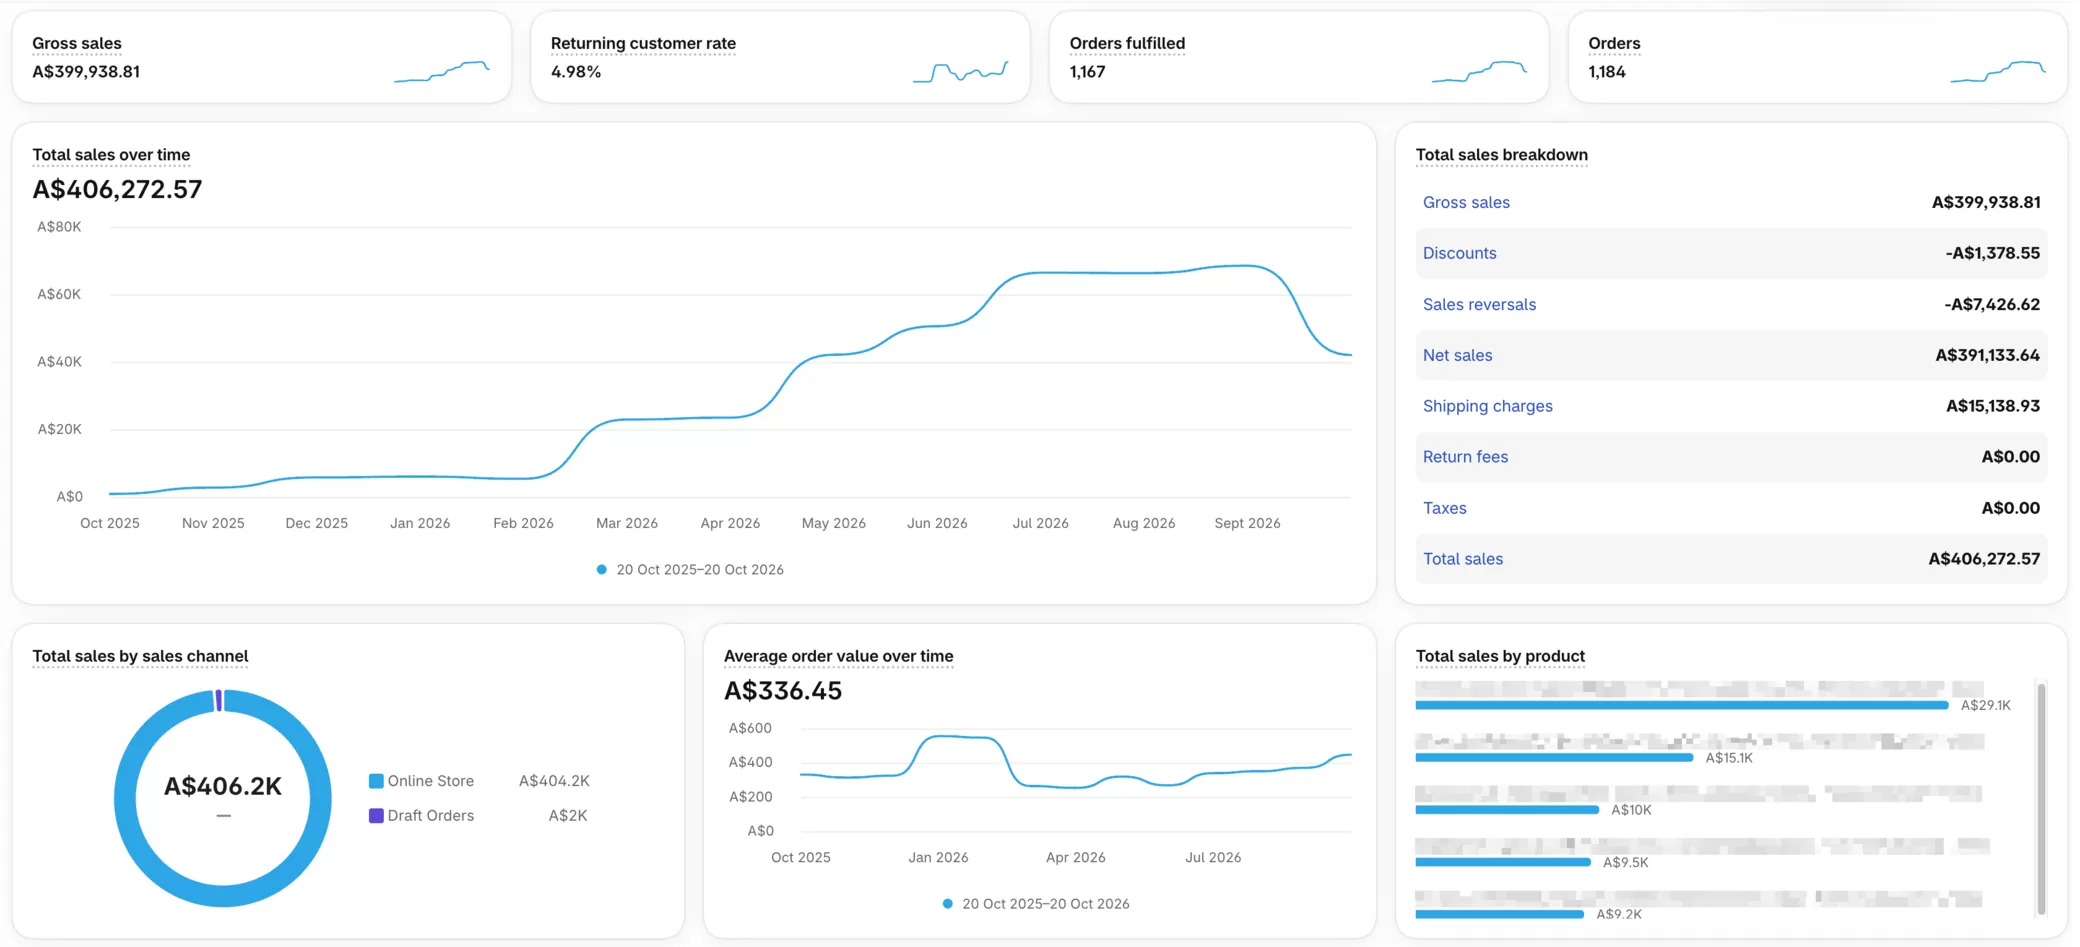
Resource Electrical builds heavy-duty extension leads, adapters and power boards in a Melbourne workshop and sells them online across Australia. We set up its conversion tracking and Google Ads account from scratch. Store sales grew from about A$6K a month to A$68.7K in September 2026, and Google Ads tracked A$243,960 in sales at 7.62x ROAS.
- Conversion ValueA$244K
- Ad SpendA$32.0K
- Purchases752
The client
Who Is Resource Electrical?
Resource Electrical (resourceelectrical.com.au) is an Australian supplier of portable power equipment. Its A-grade electricians build extension leads, power boards and adapters in-house at a Melbourne workshop. The Shopify store also sells orange circular cable and DC solar cable by the meter, EV charging adapters, switchgear and test equipment.
Event crews, builders, industrial sites and commercial operators order from it across Australia. Many orders are technical: a 32 amp three-phase lead in a set length, or an adapter from a 5-pin socket to a standard 15 amp outlet.
- Industry
- Portable power and electrical supplies
- Products
- Extension leads, adapters, power boards, cable by the meter, EV charging leads
- Market
- Australia-wide, shipped from Melbourne
- Platform
- Shopify, Google Ads (Performance Max, Shopping, Search)
- Period
- Oct 20, 2025 to Oct 11, 2026
- Goal
- Build tracking and an account from zero, then grow sales at a profitable ROAS
The starting point
Where Did the Account Start?
At zero. The Google Ads account was new, and nothing in it could tell a sale from a click. Smart Bidding learns from the conversions you count, so with none counted, every bid was a guess.
- A campaign with zero recorded sales. The account's first search campaign ran in October 2025 and spent A$341 on 82 clicks without recording a single conversion.
- No purchase tracking. No conversion action in the account had recorded a completed order or its value.
- No Shopping, Performance Max or brand campaign running. One Performance Max campaign had been set up but never spent.
- Store sales of about A$5K to A$6K a month in December, January and February, per Shopify.
- A catalog sold by specification. Leads, boards and adapters come in ratings from 10A to 63A, single or three phase, with different pin counts and lengths.
- Searches that name the exact part. People type "32 amp to 15 amp adapter" or "16mm twin and earth", not "electrical supplies".
The timeline
How Did It Go From Zero to A$68.7K?
In three moves. Count every sale first, give the products that already sell their own budget, then raise spend in steps while the return holds.
Ad figures are from Google Ads, filtered to the six enabled campaigns. Store figures are from Shopify Analytics. Both screenshots are in the proof section.
- October 2025
The account opens
The first search campaign spends A$341 on 82 clicks. Google Ads records no sales, because nothing is counting them.
- December 2025
We build the account
Four campaigns go live on test budgets: Performance Max on a hand-picked list of best sellers, Standard Shopping on the full catalog, Brand Search and Dynamic Search Ads. They spend A$633 across December, January and February.
- March 2, 2026
The first tracked sale
One purchase action now counts completed orders and their value. The first sale lands on March 2, and daily spend moves from under A$10 to about A$35. March closes at 9.54x ROAS.
- April 2026
The most efficient month
13.79x ROAS: A$20,588 in tracked sales on A$1,493 of spend.
- May 2026
A second Performance Max campaign
The rest of the catalog gets its own campaign, with the best sellers excluded so the two never bid on the same product. Monthly spend passes A$2,000.
- June to July 2026
Scaling at about 10x
Spend rises to A$4,824 in July while ROAS holds at 10.69x in June and 9.65x in July. Tracked sales reach A$46,547 a month.
- September 2026
Store sales hit A$68.7K
Spend reaches A$8,202. ROAS falls to 5.17x as the extra budget buys less, and the store's sales for the month reach A$68.7K.
- October 2026
Still scaling
The Standard Shopping budget drops to A$25 a day and more of the spend runs through the two Performance Max campaigns.
What we built
Six Campaigns, Each With One Job
Tracking came first. Then every campaign got a clear role, so spend could move to whatever was working that week.
Purchase Tracking
- One purchase action counts each completed order and its value
- It is the only conversion Smart Bidding optimizes for
- Add to cart and checkout steps recorded as secondary signals
- Old app-created and duplicate actions removed
Performance Max: Best Sellers
- A hand-picked list of proven products in its own campaign
- Bids on Maximize conversion value
- 44% of spend and 53% of tracked value
- 9.11x ROAS on A$14,184
Performance Max: Rest of Catalog
- Launched in May 2026 for every other product
- Best sellers excluded, so the two campaigns never compete
- Bids on Maximize conversion value
- 9.38x ROAS on A$5,449
Standard Shopping
- The full catalog on Target ROAS
- Its search term report shows which spec phrases convert
- Converted searches like "32 amp to 20 amp adapter" and "3 phase to single phase"
- 4.85x ROAS on A$8,654
Brand Search
- Searches for "resource electrical" get their own campaign
- The brand name alone tracked A$14,366 in sales
- 9.62x ROAS, the best of the six
- Kept on a small, steady budget
Dynamic Search Ads
- Matches searches to pages on the site
- Catches phrases nobody would write a keyword for, like "25mm xlpe"
- 2.81x ROAS on A$1,407
- A low-cost feed of new search terms
Month by month
What Did Each Month Bring In?
Tracked sales rose from A$10,062 in March to a peak of A$47,877 in August. Hover or tap a month to see its numbers.
- Tracked conversion value
- Ad spend
* October covers the 1st to the 11th only, the last day in the Google Ads screenshot. The full numbers are in the table below.
| Month | Ad spend | Tracked value | ROAS | Value after ad spend |
|---|---|---|---|---|
| Dec 2025 to Feb 2026Test budgets, no tracking | A$633 | A$0 | None | -A$633 |
| March 2026 | A$1,055 | A$10,062 | 9.54x | A$9,007 |
| April 2026 | A$1,493 | A$20,588 | 13.79x | A$19,095 |
| May 2026 | A$2,250 | A$24,839 | 11.04x | A$22,589 |
| June 2026 | A$3,680 | A$39,344 | 10.69x | A$35,664 |
| July 2026 | A$4,824 | A$46,547 | 9.65x | A$41,722 |
| August 2026 | A$7,134 | A$47,877 | 6.71x | A$40,743 |
| September 2026 | A$8,202 | A$42,364 | 5.17x | A$34,163 |
| October 1 to 11, 2026Partial month | A$2,748 | A$12,339 | 4.49x | A$9,591 |
| Total | A$32,019 | A$243,960 | 7.62x | A$211,941 |
The proof
A$243,960 in Tracked Sales at 7.62x ROAS
Two dashboards, so you can check one against the other. Google Ads counts the sales it can tie to an ad click. Shopify counts every order the store took over nearly the same twelve months: A$406,273 in total sales from 1,184 orders, at an average of A$336.45 each.
Before Logical Gecko
- A new account whose first campaign recorded zero sales
- No purchase tracking, so bidding had nothing to learn from
- No Shopping, Performance Max or brand campaign running
- Store sales of about A$5K to A$6K a month
After Logical Gecko
- A$243,960 in tracked sales at 7.62x ROAS
- 752 tracked purchases at A$42.57 of ad spend each
- Six campaigns, each with one job
- A$68.7K in store sales in September 2026
Scaling honestly
What Happened When Spend Passed A$5K a Month?
The return per dollar fell. From March to July, each step up in budget held between 9.5x and 13.8x. In August and September, spend rose 70% and tracked sales did not follow, so we went looking for the campaign that stopped paying.
A$4,824A$8,202
July to September: up 70%A$46,547A$42,364
July to September: down 9%9.65x5.17x
Still above 5x in every full month| Campaign | Ad spend | Share of spend | Tracked value | ROAS |
|---|---|---|---|---|
| Performance Max, best sellersMaximize conversion value | A$14,184 | 44% | A$129,208 | 9.11x |
| Standard Shopping, full catalogTarget ROAS | A$8,654 | 27% | A$41,996 | 4.85x |
| Performance Max, rest of catalogLive since May 2026 | A$5,449 | 17% | A$51,139 | 9.38x |
| Brand Search"resource electrical" and close variants | A$1,835 | 6% | A$17,643 | 9.62x |
| Dynamic Search AdsMatched to site pages | A$1,407 | 4% | A$3,959 | 2.81x |
| Display, dynamic remarketingLive since June 2026 | A$490 | 2% | A$14 | 0.03x |
| All six campaigns | A$32,019 | 100% | A$243,960 | 7.62x |
It returned 10.02x in July and 5.19x in August, then A$1,918 in tracked sales on A$2,563 of spend in September. Its budget is now A$25 a day, and the two Performance Max campaigns carry more of the spend.
It spent A$490 from June to October and tracked A$14 in sales. Performance Max already reaches past visitors, so this campaign now runs on A$3 a day.
Key lessons
What Other Stores Can Take From This
Four rules from this account that hold for any store selling a technical catalog.
Tracking is the first campaign
The A$633 spent in December, January and February produced no tracked sales and gave Smart Bidding nothing to learn from. The first tracked sale came on March 2, and that month closed at 9.54x. If your account cannot see purchases, start with conversion tracking before any budget change.
Spec searches are where the sales are
The searches that converted named the part: "32 amp to 20 amp adapter", "3 phase to single phase", "16mm twin and earth". Product titles that spell out amperage, phase, pins and length give Google the words to match them. Our guide to Google Shopping ads explains how titles decide which searches you show for.
Give proven products their own campaign
Performance Max on the best sellers took 44% of spend and returned 53% of tracked value at 9.11x. The rest of the catalog ran in a second campaign with those products excluded. Our Performance Max guide covers how the campaign type works.
Judge each extra dollar, not the average
Account ROAS stayed above 5x in every full month, yet value after ad spend peaked in July at A$41,722. Past that point we cut the campaign that stopped paying instead of the whole budget. The ROAS formula shows how to find your own break-even point.
FAQ
Questions About This Result
What results did Resource Electrical get from Google Ads?
Between October 20, 2025 and October 11, 2026, Google Ads tracked A$243,959.50 in conversion value on A$32,018.56 of ad spend, a 7.62x ROAS, from 752 purchases at A$42.57 each. Store sales reached A$68.7K in September 2026, up from about A$6K a month before purchase tracking went live.
How long did it take to see sales?
Purchase tracking recorded its first sale on March 2, 2026. ROAS was 9.54x in March and 13.79x in April, and tracked sales passed A$46,000 a month by July. Store sales reached A$68.7K in September, seven months after the first tracked sale.
Which campaign types worked best for an electrical supplies store?
Brand Search returned 9.62x, Performance Max on the rest of the catalog 9.38x and Performance Max on the best sellers 9.11x. The best-seller campaign carried 44% of the spend and 53% of the tracked value. Standard Shopping returned 4.85x overall, Dynamic Search Ads 2.81x, and dynamic remarketing on Display returned A$14 on A$490.
Why does this case study show Shopify sales as well as Google Ads?
Google Ads counts the sales it can tie to an ad click. Shopify counts every order. Showing both lets you check one against the other: over nearly the same twelve months, the store took A$406,272.57 in total sales and Google Ads tracked A$243,959.50 in conversion value.
Can you build Google Ads for my store from scratch?
Yes. We start every new account the way we started this one: purchase tracking first, then campaigns split by what already sells, then budget increases in steps. Book a free Google Ads audit and we will tell you whether we found what is holding your account back, with one or two of the issues explained.
Free audit
Want Results Like This In Your Account?
We will audit your Google Ads account and tell you whether we found what is holding it back, with one or two of the issues explained. No obligation, no pressure.
Selected Case Studies
More Google Ads Case Studies
Real accounts, real spend, real tracked revenue. See exactly how each result was built.
 Oil-Stores
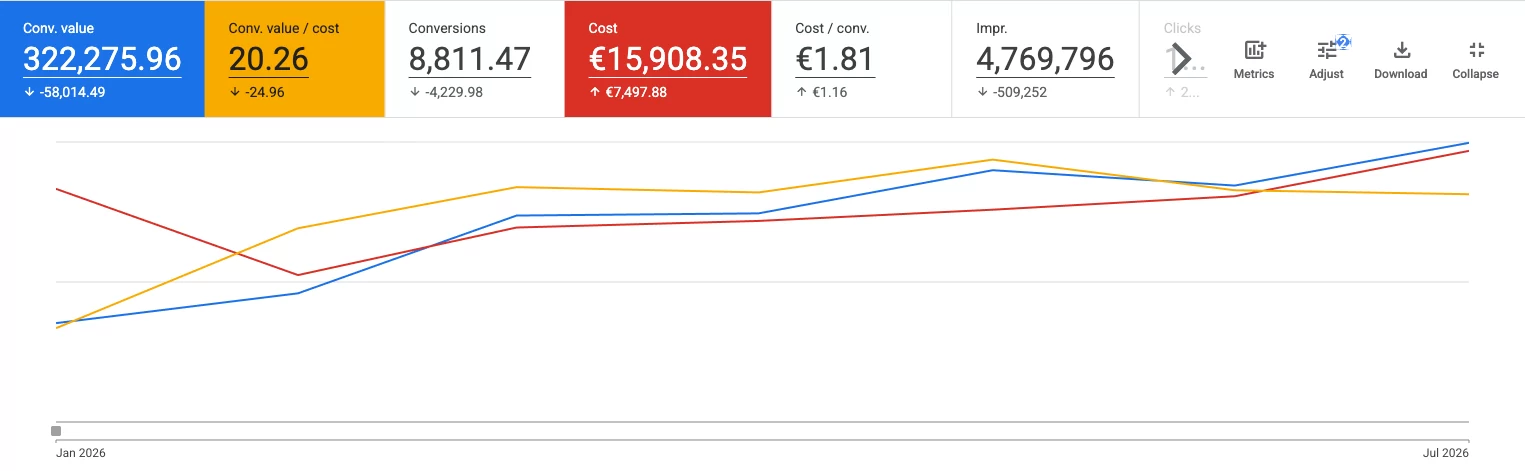
20.26x ROAS on an Auto Parts Catalog
A ground-up restructure of a sprawling automotive parts and lubricants catalog turned a fragmented account into €322,000 in tracked conversion value.
ROAS20.26xRevenue€322KCost/Conv€1.81 Read case study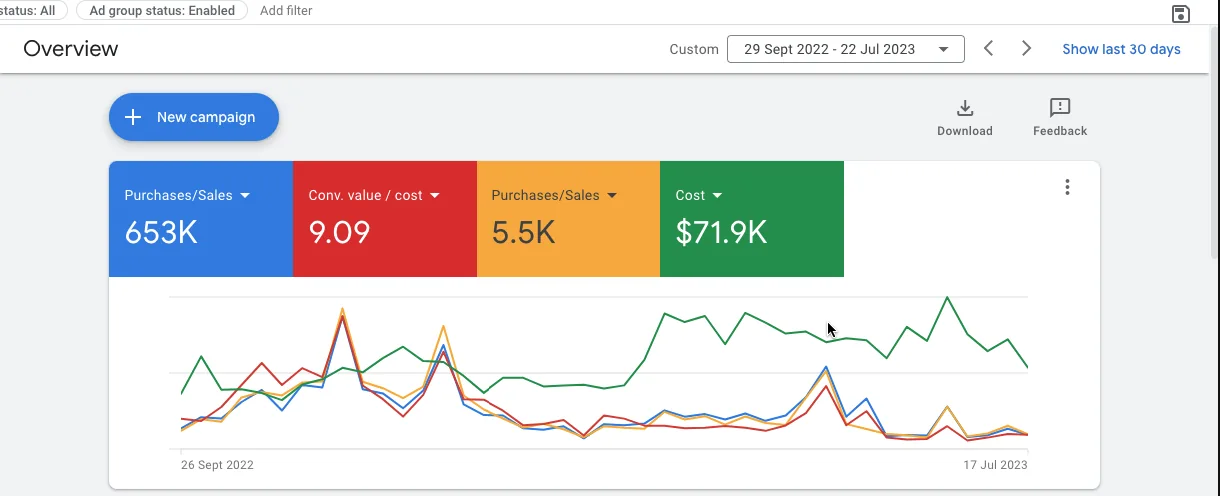 Spacey Digital
9.09x ROAS and $653K in Tracked Revenue
A full account restructure and bidding overhaul turned inefficient spend into $653,000 in tracked conversion value at a $13.07 cost per conversion.
ROAS9.09xRevenue$653KCost/Conv$13.07 Read case study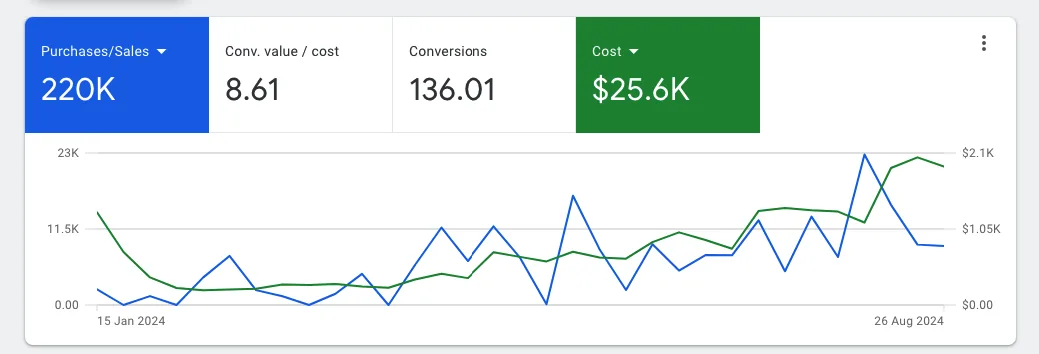 Fire Pit Surplus
8.6x ROAS on High-Ticket Outdoor Products
A seasonal, high-ticket outdoor brand scaled to $220,000 in sales at 8.6x ROAS by targeting high-intent searches instead of chasing volume.
ROAS8.6xSales$220KAd Spend$25.6K Read case study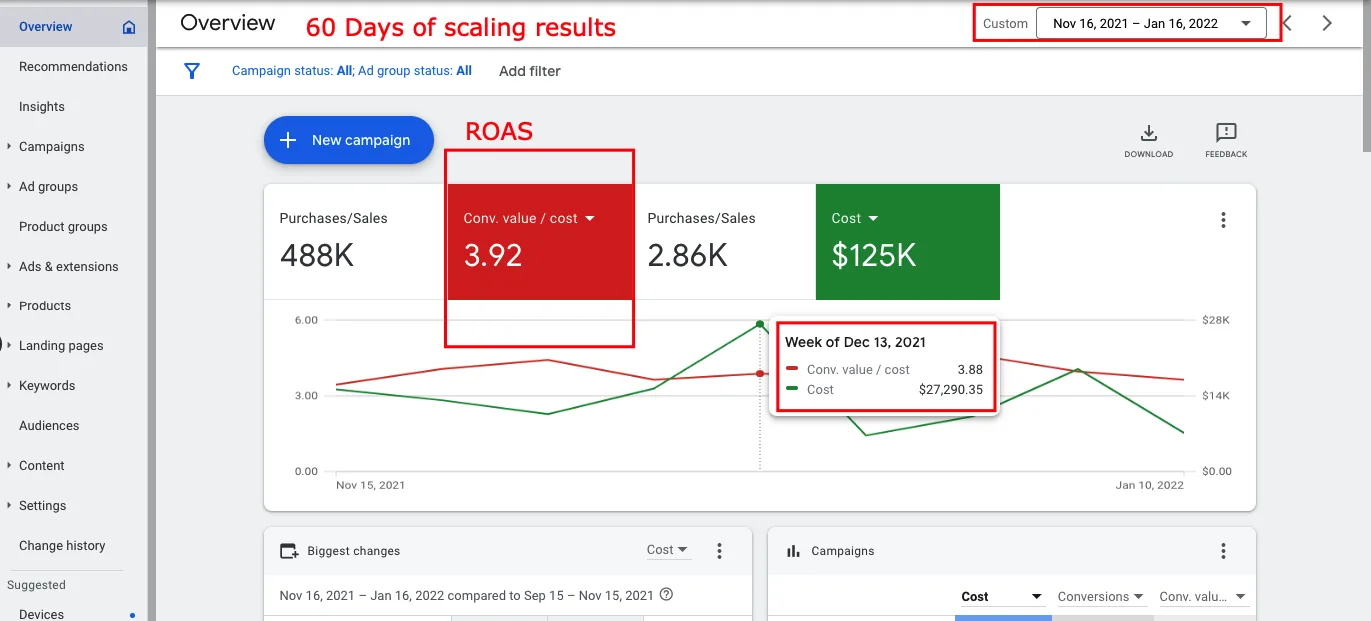 Muir Way
Breaking a $50K/Month Plateau to $488K in 60 Days
Full-funnel restructuring and audience expansion pushed a stalled wall-art brand past its ceiling to $488,000 in tracked revenue at 3.92x ROAS.
ROAS3.92xRevenue$488KConversions2.86K Read case studyThese case studies represent selected examples from our broader Google Ads work. Results vary depending on budget, offer, market competition, tracking setup, and website conversion rate.