Quick answer
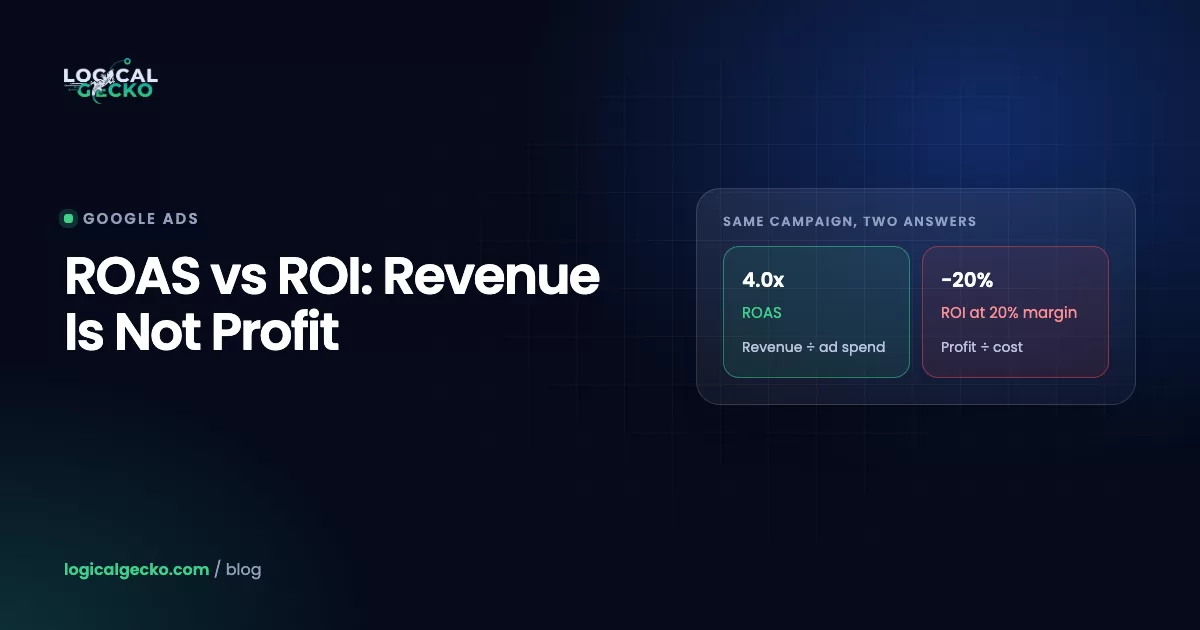
ROAS measures revenue per ad dollar; ROI measures profit per dollar invested. ROAS = ad revenue ÷ ad spend. ROI = (profit − cost) ÷ cost. Your margin links them: ad ROI = ROAS × contribution margin − 1. So the same 4x ROAS is a 20% loss at a 20% margin and a 100% return at a 50% margin.
Key takeaways
- ROAS divides the revenue an ad platform credits to your ads by your ad spend, so it measures sales efficiency, not profit.
- ROI divides profit after costs by the money invested, so it is the only one of the two that tells you whether your ads made money.
- You convert ROAS to ROI with your contribution margin: ad ROI = ROAS × margin − 1, which turns a 4x ROAS into −20% at a 20% margin and +100% at a 50% margin.
- Use ROAS, through Target ROAS in Google Ads, to steer bids, and set that target from the ROI you need with (1 + target ROI) ÷ margin.
- Two stores, products or channels with the same ROAS can have opposite profit results, so never compare ROAS across margins that differ.
On this page
- What is the difference between ROAS and ROI?
- What is ROAS and how do you calculate it?
- What is ROI and how do you calculate it for marketing?
- ROAS vs ROI: how do they compare side by side?
- How can a good ROAS still lose money?
- How do you convert ROAS to ROI?
- Should you bid on ROAS or ROI in Google Ads?
- When should you use ROI instead of ROAS?
- How do POAS, MER, CAC and LTV relate to ROAS and ROI?
- What mistakes make ROAS and ROI misleading?
- How should you report ROAS and ROI together?
- FAQ
What is the difference between ROAS and ROI?
ROAS (return on ad spend) measures how much revenue your ads bring in for each dollar of ad spend. ROI (return on investment) measures how much profit you keep for each dollar you invest, after costs. ROAS answers "are my ads producing sales efficiently?" ROI answers "did this make money?" A campaign can pass the first test and fail the second.
The gap between the two is your margin. ROAS stops at revenue. ROI goes on to subtract what those sales cost you to deliver: the product, shipping, payment fees, returns and the ad spend itself. That is how a store owner can see a 4x ROAS in Google Ads and still find less money in the bank at the end of the month.
ROAS: return on ad spend
- Revenue from ads ÷ ad spend
- Shown as 4x, 4:1 or 400%
- Ignores product, shipping and fee costs
- Updates daily inside Google Ads
- Steers bids, keywords and products
ROI: return on investment
- (Profit − cost) ÷ cost
- Shown as a percentage, such as 60% or −20%
- Counts every cost the sales create
- Needs margin data from your own books
- Decides whether the ads are worth the money
You need both. ROAS is fast and lives inside the ad platform, so it is the number you steer with. ROI is slower and needs your cost data, so it is the number you judge with. The sections below show how the two connect, and how to pick a ROAS target that delivers the ROI you want.
What is ROAS and how do you calculate it?
ROAS is the revenue credited to your ads divided by what you spent on those ads. Spend $2,000 on a Shopping campaign that brings in $9,000 in sales, and your ROAS is 4.5, written as 4.5x, 4.5:1 or 450%.
Revenue from ads ÷ Ad spendThe formula has two parts:
- Revenue from ads is the conversion value your ad platform credits to the campaign. In Google Ads it sits in the Conv. value column, and ROAS itself is the Conv. value / cost column.
- Ad spend is the media cost only, the Cost column. Agency fees, software and creative production stay out of ROAS.
ROAS says nothing about product cost, shipping or returns. That keeps it fast and simple, and it also makes it easy to misread. Our ROAS formula guide covers the calculation in depth, with worked examples and break-even ROAS, so this page stays on how ROAS relates to profit.
What is ROI and how do you calculate it for marketing?
ROI is what an investment earned minus what it cost, divided by what it cost, shown as a percentage. For advertising, the profit is the margin your ad-driven sales earned, and the cost is what you paid to win those sales.
(Profit from the sales − Cost of the investment) ÷ Cost of the investment × 100The parts of the marketing ROI formula:
- Profit from the sales means contribution profit: revenue minus every cost that grows with each order. That covers product cost (COGS), outbound shipping, packaging, payment fees and an allowance for returns and refunds.
- Cost of the investment is ad spend at minimum. For a full marketing ROI, add agency or freelancer fees, ad software and the cost of making creative.
Two levels of ROI are useful, and mixing them up causes most of the confusion in reports:
| Level | Costs counted | Question it answers | Use it for |
|---|---|---|---|
| Ad ROI | Variable order costs and ad spend | Did each ad dollar earn more profit than it cost? | Setting ROAS targets, comparing campaigns |
| Marketing ROI | Variable order costs, ad spend, fees, software and creative | Did the whole marketing program pay for itself? | Monthly and quarterly budget decisions |
Rent, salaries and other overhead belong in neither. They exist whether or not you advertise. They matter for net profit on your P&L, but loading them into ROI makes every campaign look worse than its real effect on the business.
ROAS vs ROI: how do they compare side by side?
ROAS and ROI differ in what they measure, the inputs they need, how fast you get them and who relies on them. The table puts the two next to each other.
| ROAS | ROI | |
|---|---|---|
| What it measures | Revenue produced per ad dollar | Profit kept per dollar invested |
| Formula | Revenue from ads ÷ Ad spend | (Profit − Cost) ÷ Cost |
| Inputs | Attributed conversion value and ad spend | Revenue, COGS, shipping, fees, returns, ad spend and other marketing costs |
| Where the data lives | Google Ads, Microsoft Ads, Meta | Your store, your accounting software and the ad platforms |
| Usual format | 4x, 4:1 or 400% | A percentage, such as 60% or −20% |
| Break-even point | 1 ÷ contribution margin (2.5x at a 40% margin) | 0% |
| How fast you get it | Daily, with some conversion lag | Weekly or monthly, once costs and returns settle |
| Who uses it | PPC managers, ad specialists, Smart Bidding | Owners, finance teams, anyone setting budgets |
| Best for | Bids, search terms, products, campaigns with similar margins | Budgets, channel choices, products with different margins |
| Blind spot | Costs, margins and returns | Slow, and only as good as your cost data |
The short version: ROAS is an efficiency metric for the ad account, and ROI is a profit metric for the business. When the two disagree, ROI is the one your bank balance follows.
How can a good ROAS still lose money?
A good-looking ROAS loses money when your margin is too thin to cover the ad spend. At a 4x ROAS, ads take 25% of revenue. If your contribution margin is under 25%, every ad-driven sale costs more to win than it earns.
For example, take two illustrative stores. Both spend $10,000 on Google Ads in a month, and both see $40,000 in conversion value, so both dashboards show a 4x ROAS. Store A resells branded phone accessories at a 20% contribution margin after product cost, shipping, payment fees and returns. Store B sells its own skincare line at a 50% contribution margin.
| Line | Store A (20% margin) | Store B (50% margin) |
|---|---|---|
| Ad spend | $10,000 | $10,000 |
| Revenue from ads | $40,000 | $40,000 |
| ROAS | 4.0x | 4.0x |
| Variable costs (COGS, shipping, fees, returns) | $32,000 | $20,000 |
| Contribution profit | $8,000 | $20,000 |
| Profit after ad spend | −$2,000 | +$10,000 |
| Ad ROI | −20% | +100% |
Same ROAS, opposite results. Store A loses $2,000 a month on its ads and would lose more by scaling them. Store B doubles every ad dollar and should test spending more. A ROAS benchmark cannot tell you which store you are.
The same math applies to published benchmarks. Triple Whale's 2026 Google Ads benchmark, covering more than 21,000 brands from August 2025 to July 2026, puts ROAS at 3.27x. At a 40% margin, that is an ad ROI of about 31%. At a 30% margin, it is about −2%, a small loss on every sale.
Adding fixed marketing costs
Store B's 100% is its ad ROI. Say it also pays $2,500 a month for campaign management, product photos and a reporting tool. Its marketing ROI is ($20,000 − $10,000 − $2,500) ÷ ($10,000 + $2,500) = $7,500 ÷ $12,500 = 60%. Still healthy, but this is the number to use when you decide whether the whole program is worth it.
How do you convert ROAS to ROI?
Multiply ROAS by your contribution margin and subtract 1. The result is your ad ROI as a decimal. A 4x ROAS at a 40% margin gives 4 × 0.40 − 1 = 0.60, a 60% ROI.
Ad ROI = ROAS × Contribution margin − 1Why it works: each $1 of ad spend brings in ROAS dollars of revenue. Your margin share of that revenue is the profit before ads, which is ROAS × margin. Subtract the $1 you spent, divide by that same $1, and you have ROI.
Run the formula backward to find the ROAS a given ROI requires:
ROAS needed = (1 + Target ROI) ÷ Contribution marginSet the target ROI to zero and this becomes 1 ÷ margin, your break-even ROAS. The break-even ROAS section of our ROAS guide lists which costs belong in that margin, so we will not repeat the derivation here.
This grid converts common ROAS levels to ad ROI at five contribution margins:
| ROAS | 20% margin | 30% margin | 40% margin | 50% margin | 60% margin |
|---|---|---|---|---|---|
| 2x (200%) | −60% | −40% | −20% | 0% | +20% |
| 3x (300%) | −40% | −10% | +20% | +50% | +80% |
| 4x (400%) | −20% | +20% | +60% | +100% | +140% |
| 5x (500%) | 0% | +50% | +100% | +150% | +200% |
| 6x (600%) | +20% | +80% | +140% | +200% | +260% |
| 8x (800%) | +60% | +140% | +220% | +300% | +380% |
To read it, find your ROAS on the left and your margin across the top. Negative cells are losses, and a 0% cell is break-even. A 5x ROAS at a 20% margin only breaks even, and a 3x ROAS needs a margin above 33% to make any money.
Should you bid on ROAS or ROI in Google Ads?
Bid on ROAS, but choose the target from the ROI you need. Google Ads only sees conversion value and cost, so its value-based bidding works in ROAS. Your margin is what turns an ROI goal into the right ROAS target.
Target ROAS sets bids to get as much conversion value as possible while keeping the average Conv. value / cost near your target. It is entered as a percentage: Google's own example is $5 in sales for every $1 of ad spend, a 500% target. Google's comparison table even lists it as the strategy for when your "priority is getting conversion value at a specific ROI target" (About Target ROAS bidding).
(1 + Target ad ROI) ÷ Contribution margin × 100A store with a 40% margin that wants a 50% ad ROI enters (1 + 0.50) ÷ 0.40 × 100 = 375%. The same store aiming for a 25% ad ROI needs (1 + 0.25) ÷ 0.40 = 3.125x, or about 313%.
- Find your contribution margin by product group. Use revenue minus COGS, shipping, fees and returns, not price minus product cost.
- Pick the ad ROI each group must earn. It has to cover fees, software and overhead that the ad spend does not.
- Convert it to a Target ROAS with the formula above, one target per margin tier.
- Start near the ROAS the campaign already achieves. Google recommends lowering the target gradually to grow volume and giving each change one to two conversion cycles.
- Check ROI monthly with real costs and returns, then adjust the targets.
As of October 2026, three Google changes matter for this setup:
- The name. Starting in June 2026, "Maximize conversion value with a Target ROAS" is labeled simply "Target ROAS". Google says the bidding behavior is the same.
- The data minimum. Search and Shopping campaigns need at least 15 conversions in the past 30 days, and conversions must carry a value above zero.
- Targets bind more tightly. Since August 17, 2026, budget-limited campaigns on target-based strategies perform more consistently toward the target you set, so a campaign that used to beat its target will trend toward it (Changes to target based bid strategies). A target set at break-even is now more likely to deliver break-even.
Can Google Ads bid on profit instead of revenue?
Yes, if you change what you call value. Google defines the target as the average conversion value "(for example, revenue)" per ad dollar, so the value you send does not have to be revenue. A store that passes gross profit as its conversion value turns Target ROAS into a profit target, which is POAS bidding in practice. A lighter first step is reporting: conversions with cart data, combined with cost of goods sold in your Merchant Center feed, adds gross profit metrics to Google Ads (About conversions with cart data).
In Performance Max campaigns, one target covers every channel the campaign serves, so a wrong margin assumption spreads across Search, Shopping, YouTube and Display at once. Separate products into campaigns or asset groups by margin before you set targets.
When should you use ROI instead of ROAS?
Use ROI for any decision about money leaving the business: how big the ad budget should be, whether a channel is worth keeping, whether to hire help and which product lines to push. ROAS cannot answer those questions because it does not know your costs.
- Setting next month's budget: scale campaigns with a positive ad ROI, and fix or pause the rest
- Comparing channels or product lines with different margins, such as private-label goods against resold brands
- Judging agency, freelancer and software costs, which marketing ROI includes and ROAS never will
- Reporting to a partner, lender or investor, who reads profit rather than platform revenue
- Valuing repeat orders, since a 6 or 12 month ROI can include reorders that a 30-day ROAS window misses
Use ROAS for the decisions in between: daily bid targets, which search terms and products get budget, and which ads to pause. The split we use on eCommerce accounts is simple. Steer weekly on ROAS against a target derived from margin, and judge monthly on ROI built from store and accounting data.
How do POAS, MER, CAC and LTV relate to ROAS and ROI?
POAS, MER, CAC and LTV fill the gaps between ROAS and ROI. POAS adds margin to ROAS. MER removes platform attribution. CAC and LTV measure the cost and value of winning a new paying client rather than a single order.
| Metric | Formula | Question it answers | Link to ROAS and ROI |
|---|---|---|---|
| POAS (profit on ad spend) | Contribution profit from ads ÷ Ad spend | How much profit does each ad dollar return? | POAS = ROAS × margin; ad ROI = POAS − 1; break-even is 1.0 |
| MER (marketing efficiency ratio) | Total store revenue ÷ Total marketing spend | Is marketing as a whole paying off? | A blended ROAS from store data, with no double counting between platforms |
| CAC (acquisition cost per new client) | Marketing spend ÷ New paying clients | What does one new client cost? | ROAS values first and repeat orders alike; CAC isolates new ones |
| LTV (lifetime value) | Contribution profit per client over the whole relationship | What is a new client worth over time? | LTV ÷ CAC works like ROI stretched over a client's lifetime |
POAS vs ROAS. POAS is ROAS with the margin already applied. Store B in the example above has a POAS of $20,000 ÷ $10,000 = 2.0, and Store A has 0.8. Anything under 1.0 loses money, which makes POAS easier to read than ROAS for anyone who does not know the margin.
MER vs ROAS. Each ad platform credits sales by its own rules, and their claims often add up to more than the store actually sold. MER, sometimes called blended ROAS, divides your real store revenue by all marketing spend, so overlap cannot inflate it. The ROI formula works on it too: MER × margin − 1 gives a whole-store marketing ROI before fixed costs.
CAC, LTV and acquisition bidding. If people reorder, a first order can break even on purpose and still pay off over the client's lifetime. Google's lifecycle goals let value-based bidding bid higher for new purchasers than for returning ones in Search, Performance Max, Shopping and Demand Gen campaigns (About lifecycle goals). Lower your ROAS target for acquisition only when your own repeat-order data supports it. To estimate what clicks and new clients will cost before you launch, see how much Google Ads costs.
What mistakes make ROAS and ROI misleading?
Most errors push the numbers in the flattering direction: they inflate revenue or leave costs out. These are the six we see most often in account audits.
- Ignoring returns and refunds. Google Ads counts a sale when it happens. A returned order stays in your conversion value unless you retract it, or restate it for a partial return, with conversion adjustments. Google uses adjustments for automated bidding only when they arrive within 7 days of the conversion (About conversion adjustments). Net out your return rate in ROI even if you never upload adjustments.
- Leaving out shipping, fees and packaging. Gross margin overstates ROI. A $70 order with $35 in product cost has a 50% gross margin. After $8 of shipping, $2.40 in payment fees and a $2.10 returns allowance, $22.50 is left: a 32% contribution margin. At a 4x ROAS, that is about a 29% ad ROI, not the 100% that gross margin suggests.
- Counting tax and shipping in conversion value. If your purchase tag sends the full order total, ROAS includes money that was never yours to keep. Compare the value your tag sends with a real order; our guide to Google Ads conversion tracking shows how to check it.
- Comparing ROAS across stores, products or channels with different margins. "A competitor gets 6x" means nothing without their margin. Inside one account, a single target for products at 25% and 60% margins overspends on one group and starves the other. Split them by margin tier. On Oil-Stores, Shopping priority tiers were set by product margin and category, and the account reached 20.26x ROAS: €322,276 in tracked conversion value on €15,908 of spend from January 1 to July 31, 2026. That is still a revenue ratio. The profit behind it depends on each line's margin, which is why the structure was built around margin.
- Reading a 400% ROAS as a 400% return. 400% ROAS is $4 of revenue per $1 of spend. At a 40% margin it is a 60% ROI.
- Using platform revenue for ROI. ROI built on revenue that two platforms both claim is inflated twice. Build ROI from store revenue, or check it against MER.
How should you report ROAS and ROI together?
Report them as one chain, running from platform ROAS to the profit that reaches your bank account, so everyone sees where revenue becomes profit. Here is the chain for an illustrative month:
A monthly scorecard with these lines keeps the ad account and the P&L talking to each other:
- Reported ROAS by campaign, from Google Ads
- Revenue and ROAS after returns and refunds
- Contribution margin for the month, from your store and accounting data
- Ad ROI, as adjusted ROAS × margin − 1
- MER, from total store revenue and total marketing spend
- Marketing ROI, including fees, tools and creative
If ROAS looks healthy but the bank balance does not, the gap is usually in tracking, margins or targets. Our eCommerce Google Ads management sets targets from contribution margin rather than platform ROAS alone. Or start with a free Google Ads audit: we check your tracking and targets against your margins and tell you whether we found what is holding profit back.
Frequently asked questions
Is a 4x ROAS good?
A 4x ROAS is good only if your contribution margin is above 25%, because at 4x your ad spend takes 25% of revenue. At a 50% margin, 4x returns a 100% ad ROI. At a 30% margin it returns 20%. At a 20% margin it loses 20 cents of every ad dollar. Judge it against your own margin, not an industry benchmark.
Can you have a high ROAS and a negative ROI?
Yes. ROAS counts revenue and ROI counts profit after costs, so a store with thin margins can post a high ROAS and still lose money. A 5x ROAS at a 15% contribution margin brings back 75 cents of profit per ad dollar, a 25% loss. High return rates, free shipping and payment fees push ROI below zero even when the ROAS in your ad account looks strong.
Is 400% ROAS the same as 400% ROI?
No. A 400% ROAS means $4 of revenue for every $1 of ad spend. A 400% ROI means $4 of profit on top of getting the $1 back, which at a 40% contribution margin takes a 12.5x ROAS. At that same 40% margin, a 400% ROAS equals a 60% ROI. When a report shows a percentage, check which of the two it means.
What is a good ROI for paid ads?
Any ad ROI above 0% means your ads earned more contribution profit than they cost. How far above zero you need depends on what that profit must also pay for, such as agency fees, software, creative and overhead. Set your own floor from those costs, for example a 50% ad ROI, then convert it to a Target ROAS. At a 40% margin, a 50% ROI needs 3.75x.
How do you calculate POAS?
POAS (profit on ad spend) is the contribution profit from ad-driven sales divided by ad spend. If ads bring in $40,000 in sales at a 45% margin on $10,000 of spend, POAS is $18,000 ÷ $10,000 = 1.8. A POAS of 1.0 is break-even. You can also get it from ROAS by multiplying ROAS by your margin. Subtract 1 from POAS and you have ad ROI.
What is the difference between MER and ROAS?
MER (marketing efficiency ratio) is total store revenue divided by total marketing spend across every channel. ROAS is the revenue one ad platform credits to itself divided by the spend on that platform. Because MER uses your store's actual sales, overlapping attribution between Google, Meta and email cannot inflate it. Use MER to check the whole program and ROAS to steer single campaigns.
What does a negative ROI mean in advertising?
A negative ROI means your ads cost more than the profit they produced. An ad ROI of −20% means each $1 of ad spend brought back 80 cents of contribution profit. Before you cut the campaign, confirm that returns, tax and duplicate conversions are handled correctly. Then raise the Target ROAS, remove thin-margin products or pause the campaign if the math still does not work.
Sources6 references
- Google Ads Help: About Target ROAS bidding
- Google Ads Help: Changes to target based bid strategies
- Google Ads Help: About conversion adjustments
- Google Ads Help: About conversions with cart data
- Google Ads Help: About lifecycle goals
- Triple Whale: Google Ads Benchmarks by Industry (Aug 2025 to Jul 2026 data)

Safeer leads strategy at Logical Gecko, a Google Partner and Shopify Partner agency that runs Google Ads for eCommerce and home-service brands and recovers suspended Merchant Center accounts. Everything in these guides comes from work on live client accounts. More about the team.